Sample engagement · 2026
Answering “anything new?” cost more than the news.
What a cloud spend engagement looks like, on a US parcel carrier where partners asked “anything new?” about 253 times a package.
What to expect. A Cloud Margin & Cost Optimization engagement, start to finish, on a US parcel carrier. Figures are modeled on public AWS pricing.
The company
A US parcel carrier. It ships packages domestically, for businesses and for people. 1.25 million packages a day, about 38.0 million a month.
The systems are the ones you would expect. A website and a customer app. The routing system, which decides how each package travels. A primary database that holds orders and their tracking events. Handhelds on the trucks. A photo at the door as proof of delivery.
Each package takes 5 days on average from pickup to delivery. Along the way it averages 8 checkpoints, each a scan that updates tracking, and it ends with a photo on the customer’s doorstep.
The executive readout, pages 1 and 2 of the 10-page readout the carrier received. The context behind it follows, then more of the readout.
Cloud Spend Assessment · 1 · Executive readout
The bill averages $231,133 a month and, on the current design, reaches $331,638 in two years. We identified $114,731 a month (50% savings totalling $1,405,695 over the next 12 months). Three quick wins take $69,637 off with no design change. Three investments take $45,094 off today, growing to $76,324 in year two.

Already going well, no change recommended:
- Compute Savings Plan. The steady compute floor is already covered by a 1-year plan, sized at what the investments leave running.
- Non-production. Staging runs at a fraction of production, dev scales down on its own, and the partner sandbox stays up because partners test around the clock.
How we will know it worked: cloud spend per shipment falls from 0.61¢ to 0.31¢.
Page 1 of 10
Cloud Spend Assessment · 1 · Executive readout
Proposed roadmap

Three decisions sit outside engineering.
| Decision | Owner | We recommend | Unlocks |
|---|---|---|---|
| Photo retention | General Counsel | Confirm the age at which delivery photos can be permanently deleted; we propose 1 year | QW-3, $21,127 |
| Order tracking | Director of Product | Confirm the website only needs to handle a year of order tracking lookups; older orders stay in the S3 archive | I-2, $21,458 |
| Partner push feed | Partner Team | Confirm interest with the three largest partners, weighed against the savings and engineering timelines | I-3, $18,437 |
Page 2 of 10
How tracking worked
Customer updates were already event based. Each scan raised an event, and notification workers sent the texts, emails and pushes. Customers heard about four of the eight scans: picked up, arrived at the local facility, out for delivery and delivered. Texts went only for the last two: about 4.84 million texts, about 35.6 million emails and about 14.1 million pushes a month.
Every minute, a scheduled job asked the orders database anything late?, reading only the orders in transit whose next scan was overdue, using an index for efficiency.
One path did not scale as well.
Partners polled. Marketplaces and retailers show the carrier’s tracking under their own brand. They track 87.2% of packages, about 33.2 million a month, and ask the tracking API every 30 minutes from label to delivery, about 253 times. Each package changes status 8 times. The three largest partners alone make 42% of all tracking queries.
Partner polls land on the primary database, which keeps six years of orders, about 1.82 billion.

How the engagement ran
Six weeks, in four steps. Quick wins went to the carrier’s engineers as soon as they were confirmed. Everything else came together in the readout at the end.
Weeks 1 and 2 · Establish the current baseline. 2birds started from 18 months of billing and usage history, long enough to separate steady state from seasonal peaks and one-off spikes. On top of that came one-minute database metrics, API and send logs, the S3 inventory, and interviews with the platform, notifications, partner, finance, legal and support teams. Every line of the bill was traced to the system that spends it and the team that owns it.
Weeks 3 and 4 · Model the future cost curve. Each cost line was tied to what drives it, whether shipments, scans, partner polls or stored bytes, and projected two years out. Most of the time went into the details: how each part of the system works, and why it costs what it does.
Week 5 · Work through the options with engineering. Together with the carrier’s engineers, 2birds worked out each option’s specifics and got estimates for the deliverables, then priced every credible option and reviewed it with engineering.
Week 6 · Translate priorities into engineering execution. The deliverables: the readout, the unit-economics model, and a sequenced plan for engineering. 2birds walked through the readout twice, first with engineering, then with leadership and the business owners, so every party left aligned on the plan.
What the carrier received
Leadership received a 10-page PDF readout in three sections, plus the unit-economics model: a spreadsheet where every figure is a formula and each recommendation has an on/off switch. The whole readout is written for everyone; it opens with the executive readout for leaders. Pages 1 and 2 open this case study. Five more pages follow.
| Page | Section | Contents | |
|---|---|---|---|
| 1 | 1 · Executive readout | The bill, what we found, what to fund | Shown above |
| 2 | 1 · Executive readout | Proposed roadmap | Shown above |
| 3 | 2 · Unit economics | Where the $231,133 goes, per shipment and per path | |
| 4 | 2 · Unit economics | The levers, priced per unit | Shown below |
| 5 | 2 · Unit economics | The two-year cost curve | |
| 6 | 3 · Engineering investments | Overview and recommended design | Shown below |
| 7 to 9 | 3 · Engineering investments | I-1, I-2 and I-3, one page each | Shown below |
| 10 | 3 · Engineering investments | Risks and measures |
Cloud Spend Assessment · 2 · Unit economics
The levers, priced per unit
Three levers lower what the carrier pays per unit, worth $69,637 a month with no design change. Each is configuration or a schedule.
QW-1. “Out for delivery” text
A text is billed in segments. Plain GSM-7 text fits 160 characters in one segment. A single character outside that set, such as a curly apostrophe, switches the whole message to UCS-2, which fits 70 characters, or 67 a segment once a message splits. The “out for delivery” message is 103 characters, so it bills as two.
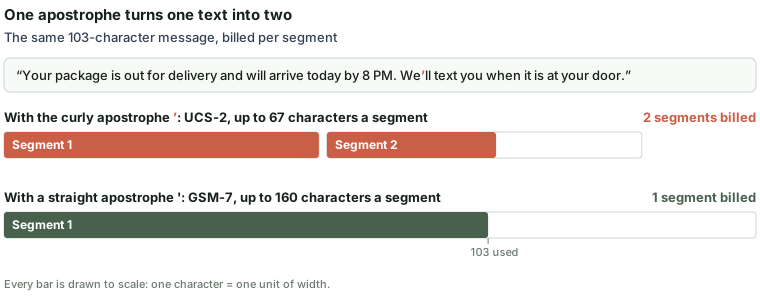
The fix is a straight apostrophe, plus a template check that blocks any character outside GSM-7 so it cannot come back ($28,845).
Per “out for delivery” text: about 2.4¢ (2 segments) to about 1.2¢ (1 segment) · $28,845 a month
QW-2. Partner-poll logs
Every successful partner poll writes seven log lines, each repeating about 1.2 KB of request context. Four of them are old debugging lines, left on from the partner migration and the encryption rollout, that no team or system uses today:
{"ts":"2026-08-14T13:02:11.484Z","level":"INFO","svc":"tracking-api","req":"7f3c9a1e","partner":"p-0412","msg":"Entering legacy partner compatibility handler", ...}

{"ts":"2026-08-14T13:02:11.485Z","level":"INFO","svc":"tracking-api","req":"7f3c9a1e","partner":"p-0412","msg":"Skipped response cache lookup: cache disabled", ...}

{"ts":"2026-08-14T13:02:11.486Z","level":"INFO","svc":"tracking-api","req":"7f3c9a1e","partner":"p-0412","msg":"Starting encryption of tracking response payload", ...}

{"ts":"2026-08-14T13:02:11.487Z","level":"INFO","svc":"tracking-api","req":"7f3c9a1e","partner":"p-0412","msg":"Finished encryption of tracking response payload", ...}
The four lines are about 4.9 KB of every poll (4,894 bytes), about 41,403 GB a month. Removing them takes that off the log ingest ($19,280) and the endpoint the logs pass through ($385): $19,665 a month.
Log ingest per million partner polls: about $3.93 to about $1.67 · $19,665 a month
QW-3. Delivery photo storage
The tracking page shows the photo for 14 days, the delivery day and 13 more; after that, it loads only when a customer asks for it. Legal confirmed the carrier only has to produce a delivery photo when a customer asks for one. The site’s access logs show how rarely that happens late: after the 13th day from delivery, photos account for 0.0003% of all photo loads.
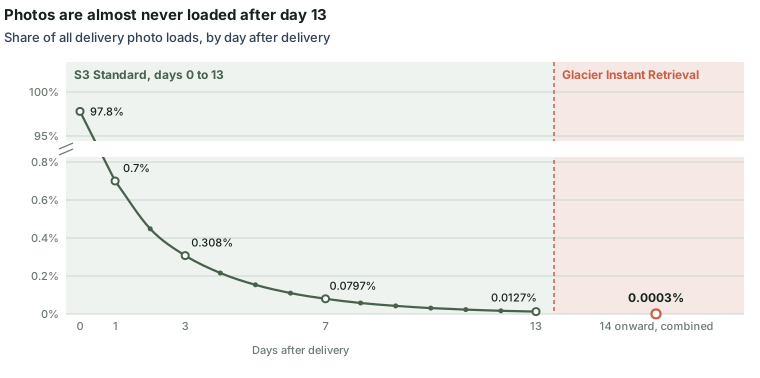
So photos stay in S3 Standard for 13 days, then move to Glacier Instant Retrieval, and the API keeps serving them from there in milliseconds.
Keeping the API on Instant Retrieval is an intentional choice. Storage drops to about a sixth: $0.004 a GB-month in Instant Retrieval against $0.023 in S3 Standard. The catch is a retrieval surcharge every time an older photo loads, about $0.0001 a photo ($0.03 a GB plus $0.01 per 1,000 requests), so a user who reloads one again and again adds cost. That risk is small next to the savings, and next to support handling every retrieval, so it is a worthwhile trade. We recommend an alarm on Glacier Instant Retrieval retrievals, so a run of reloads is caught early.
Per delivery photo, stored for a year: about 0.074¢ to about 0.019¢ · $21,127 a month
Page 4 of 10
Cloud Spend Assessment · 3 · Engineering investments
Overview
Left alone, the bill reaches $331,638 a month in two years; with every recommendation in place it is $152,911. That is $151,318 a month less in year one and $178,727 less in year two, against $114,731 today: the saving grows faster than the business, 1.56 times against 1.44 times more shipments, because more partners move to the push feed each year.

Proposed architecture updates

| # | Investment | A month | Effort | Business impact | Owner |
|---|---|---|---|---|---|
| I-1 | Resize delivery photos at capture | $5,199 | Medium | Low: customers see the same doorstep | Driver app team, Support |
| I-2 | DynamoDB tracking table and one year of orders; primary stepped down, then reserved | $21,458 | Medium | Medium: partner bursts stop slowing scans | Platform, Finance |
| I-3 | Partner push feed for the three largest partners | $18,437 | High | High: those partners get updates as they happen | Partner integrations |
Page 6 of 10
Cloud Spend Assessment · 3 · Engineering investments
I-1. Resize photos at capture · $5,199 a month
| Price | Effort | Timeline |
|---|---|---|
| No one-time cloud cost | Medium · driver app team | 6 weeks |
What changes: a driver app update resizes each delivery photo on the handheld before upload, from about 3.4 MB to about 0.33 MB, still clear enough to settle a dispute.
Why do it: smaller photos cost less to store and download: $5,199 in the first month, rising to $9,921 a month a year in as the full-size photos age out. The resize runs on the handheld, so it adds no cloud work, even at the holiday peak.
Risks: a photo too small to settle a dispute, or a faulty app build. The team tests sizes on real deliveries and starts with one depot before every handheld.
Business impact: a per-unit cut. Every delivery’s photo costs less to keep, so the saving grows with volume, and customers see the same doorstep.
Page 7 of 10
Cloud Spend Assessment · 3 · Engineering investments
I-2. Tracking table, one year of orders · $21,458 a month
| Price | Effort | Timeline |
|---|---|---|
| $3,737 one-time cloud cost | Medium · platform team | 14 weeks |
What changes: a DynamoDB table answers tracking polls. It holds every shipment in transit and those delivered in the last 13 days, kept current by the scan events. The primary keeps one year of orders and archives older months to S3, so it steps down from a db.r6i.24xlarge to a db.r6i.16xlarge, moves to gp3 storage, and is then reserved.
Why do it: polls stop landing on the database that takes orders. Its IOPS fall from 32,769 to 7,958 and its storage from 7,893 GB to 2,237 GB. The table scales with the requests on its own, even at the holiday peak.
Risks: in the minutes after a failover, finding an order by tracking number is slower until memory warms, a risk the plan accepts. The table runs beside the database for a week before partners move over one at a time, and the resize lands in one blue/green switchover, with a db.r6i.24xlarge as the fallback.
Business impact: scale. Partner polling no longer grows the database, a partner burst can’t slow orders and scans, and every partner benefits with no change on their side.
Page 8 of 10
Cloud Spend Assessment · 3 · Engineering investments
I-3. Push feed, three largest partners · $18,437 a month
| Price | Effort | Timeline |
|---|---|---|
| No one-time cloud cost | High · partner integrations team | 16 weeks |
What changes: the carrier pushes every tracking update to its three largest partners through EventBridge instead of answering their polls. One reconciliation poll per package stays.
Why do it: these partners make 42% of all tracking queries. The feed removes about 3.58 billion polls a month, saving $8,519 of API Gateway, $6,271 of logs, $2,148 of WAF and $1,499 of everything else. Partners get each update as it happens and can retire their pollers.
Risks: it needs the partners’ buy-in and engineering time, so dates follow their roadmaps. If the feed fails, deliveries retry for 24 hours and partners can still poll.
Business impact: a per-unit cut. Each package those partners track takes 8 pushes instead of 253 polls, and the saving grows as more partners follow, reaching about 51% of tracking queries by year two.
Page 9 of 10
The takeaway
The carrier got three quick wins that started at once, and three investments: smaller delivery photos; a tracking table and one year of orders, which take partner reads and every order older than a year off the database that takes orders; and a push feed for the three largest partners. Together they hold up at the fourth-quarter peak and keep a failure in one part from reaching orders or packages on the move.